![Development Wrap-Up: PINDER validation and Autodock Vina H-bond potential [GSoC 2025 - Week 12]](/images/blog_pics/gsoc-wk-12.png)
Hello, welcome back. I am reaching the end of my GSoC journey (week 12)! In the last blog post, we validated our methods with PLINDER, which is a protein-ligand dataset. This week, on the other hand, we focused on the protein-protein dataset, PINDER, and checked whether we got the same tendency as our previous validation results. Finally, we then ended up our development of implicit H-bond method and it would be merged into the main ProLIF repository soon.
Validate our method with PINDER
Similar to the protocol in my previous blog, we used explicit H-bond interaction method as ground truth. Different from the protein-ligand dataset, we have to protonate both ligand and receptor by PROPKA (PDB2PQR) and reduce (because they are both proteins). The rest of the step are the same. Here are the steps:
- Protonate the proteins.
- Calculate explicit H-bond interactions.
- Remove the hydrogens in the ligand and receptor, and then calculate implicit H-bond interactions (our method).
- Compare donor-acceptor pairs from explicit and implicit H-bond methods.
Here, we skipped the visualization of an example, if you are interested in, see the previous blog post or check the notebook in my github repo for validation.
PINDER dataset
PINDER follows the same idea of the PLINDER. The dataset was split in advance to prevent the data leaking. Also, the dataset was annotated with multiple features, including holo-apo linkage, FoldSeek and MMSeqs based interface similarity, etc.
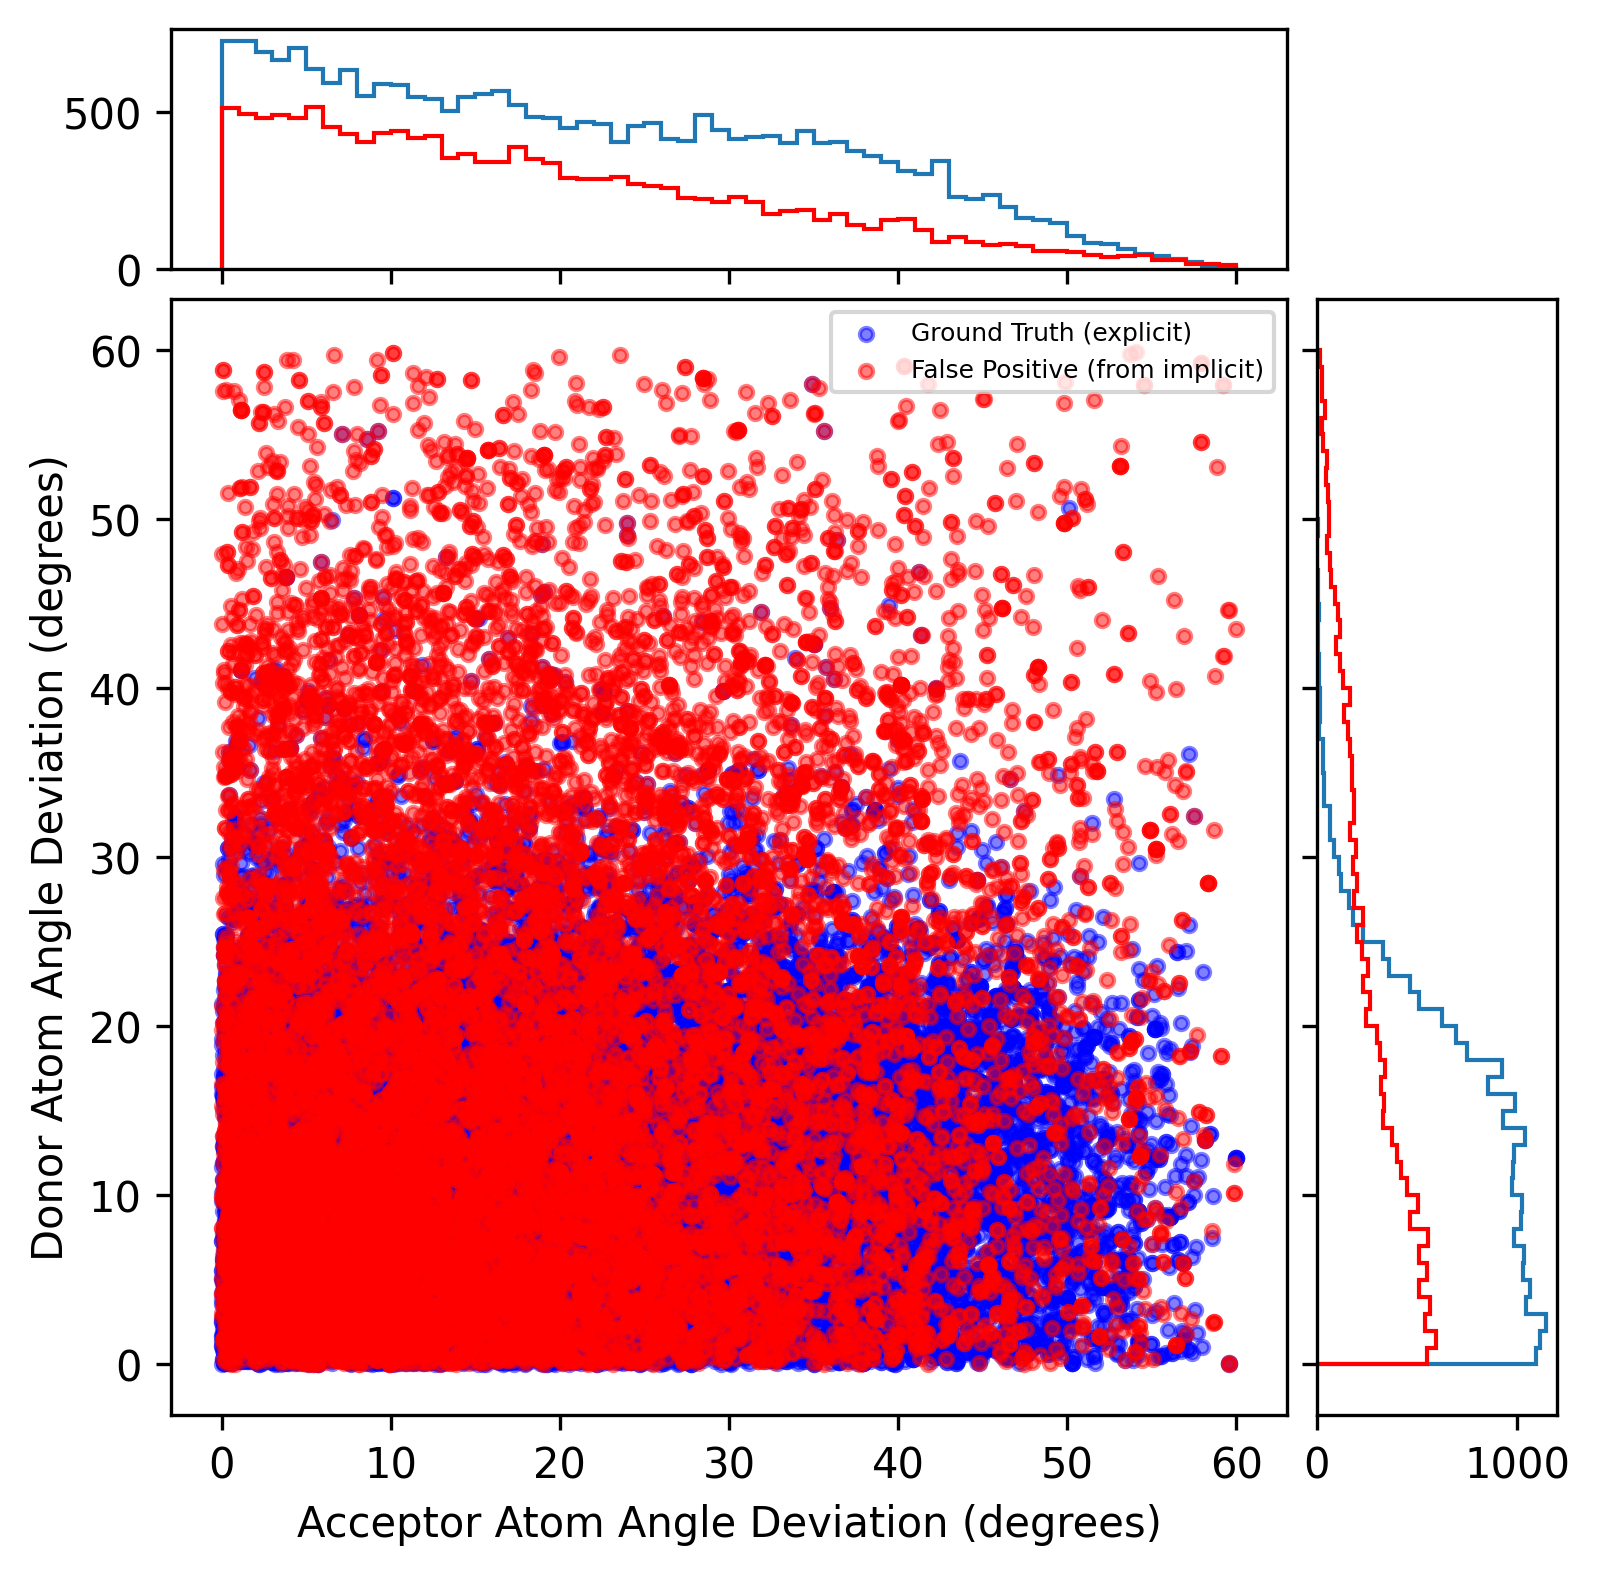
We also followed the same procedure, using the PINDER validation and testing sets for our validation and testing. Now, let’s check the distribution of the parameters (acceptor atom angle deviation, donor atom angle deviation, acceptor plane angle, donor plane angle).
Atom angle deviation’s distribution
We initially set a higher threshold (60°) for donor and acceptor atom angle deviation when calculating fingerprints in the PINDER validation set (averaged Tanimoto coefficient: 0.62, averaged positive predictive value: 0.62, averaged sensitivity: 1.00). Similar to the previous findings in PLINDER datasets, there is a clear cutoff value (25°) for donor atom angle deviation to separate the false positive and ground truth while there is no specific cutoff value for the acceptor atom angle deviation.
Validation set
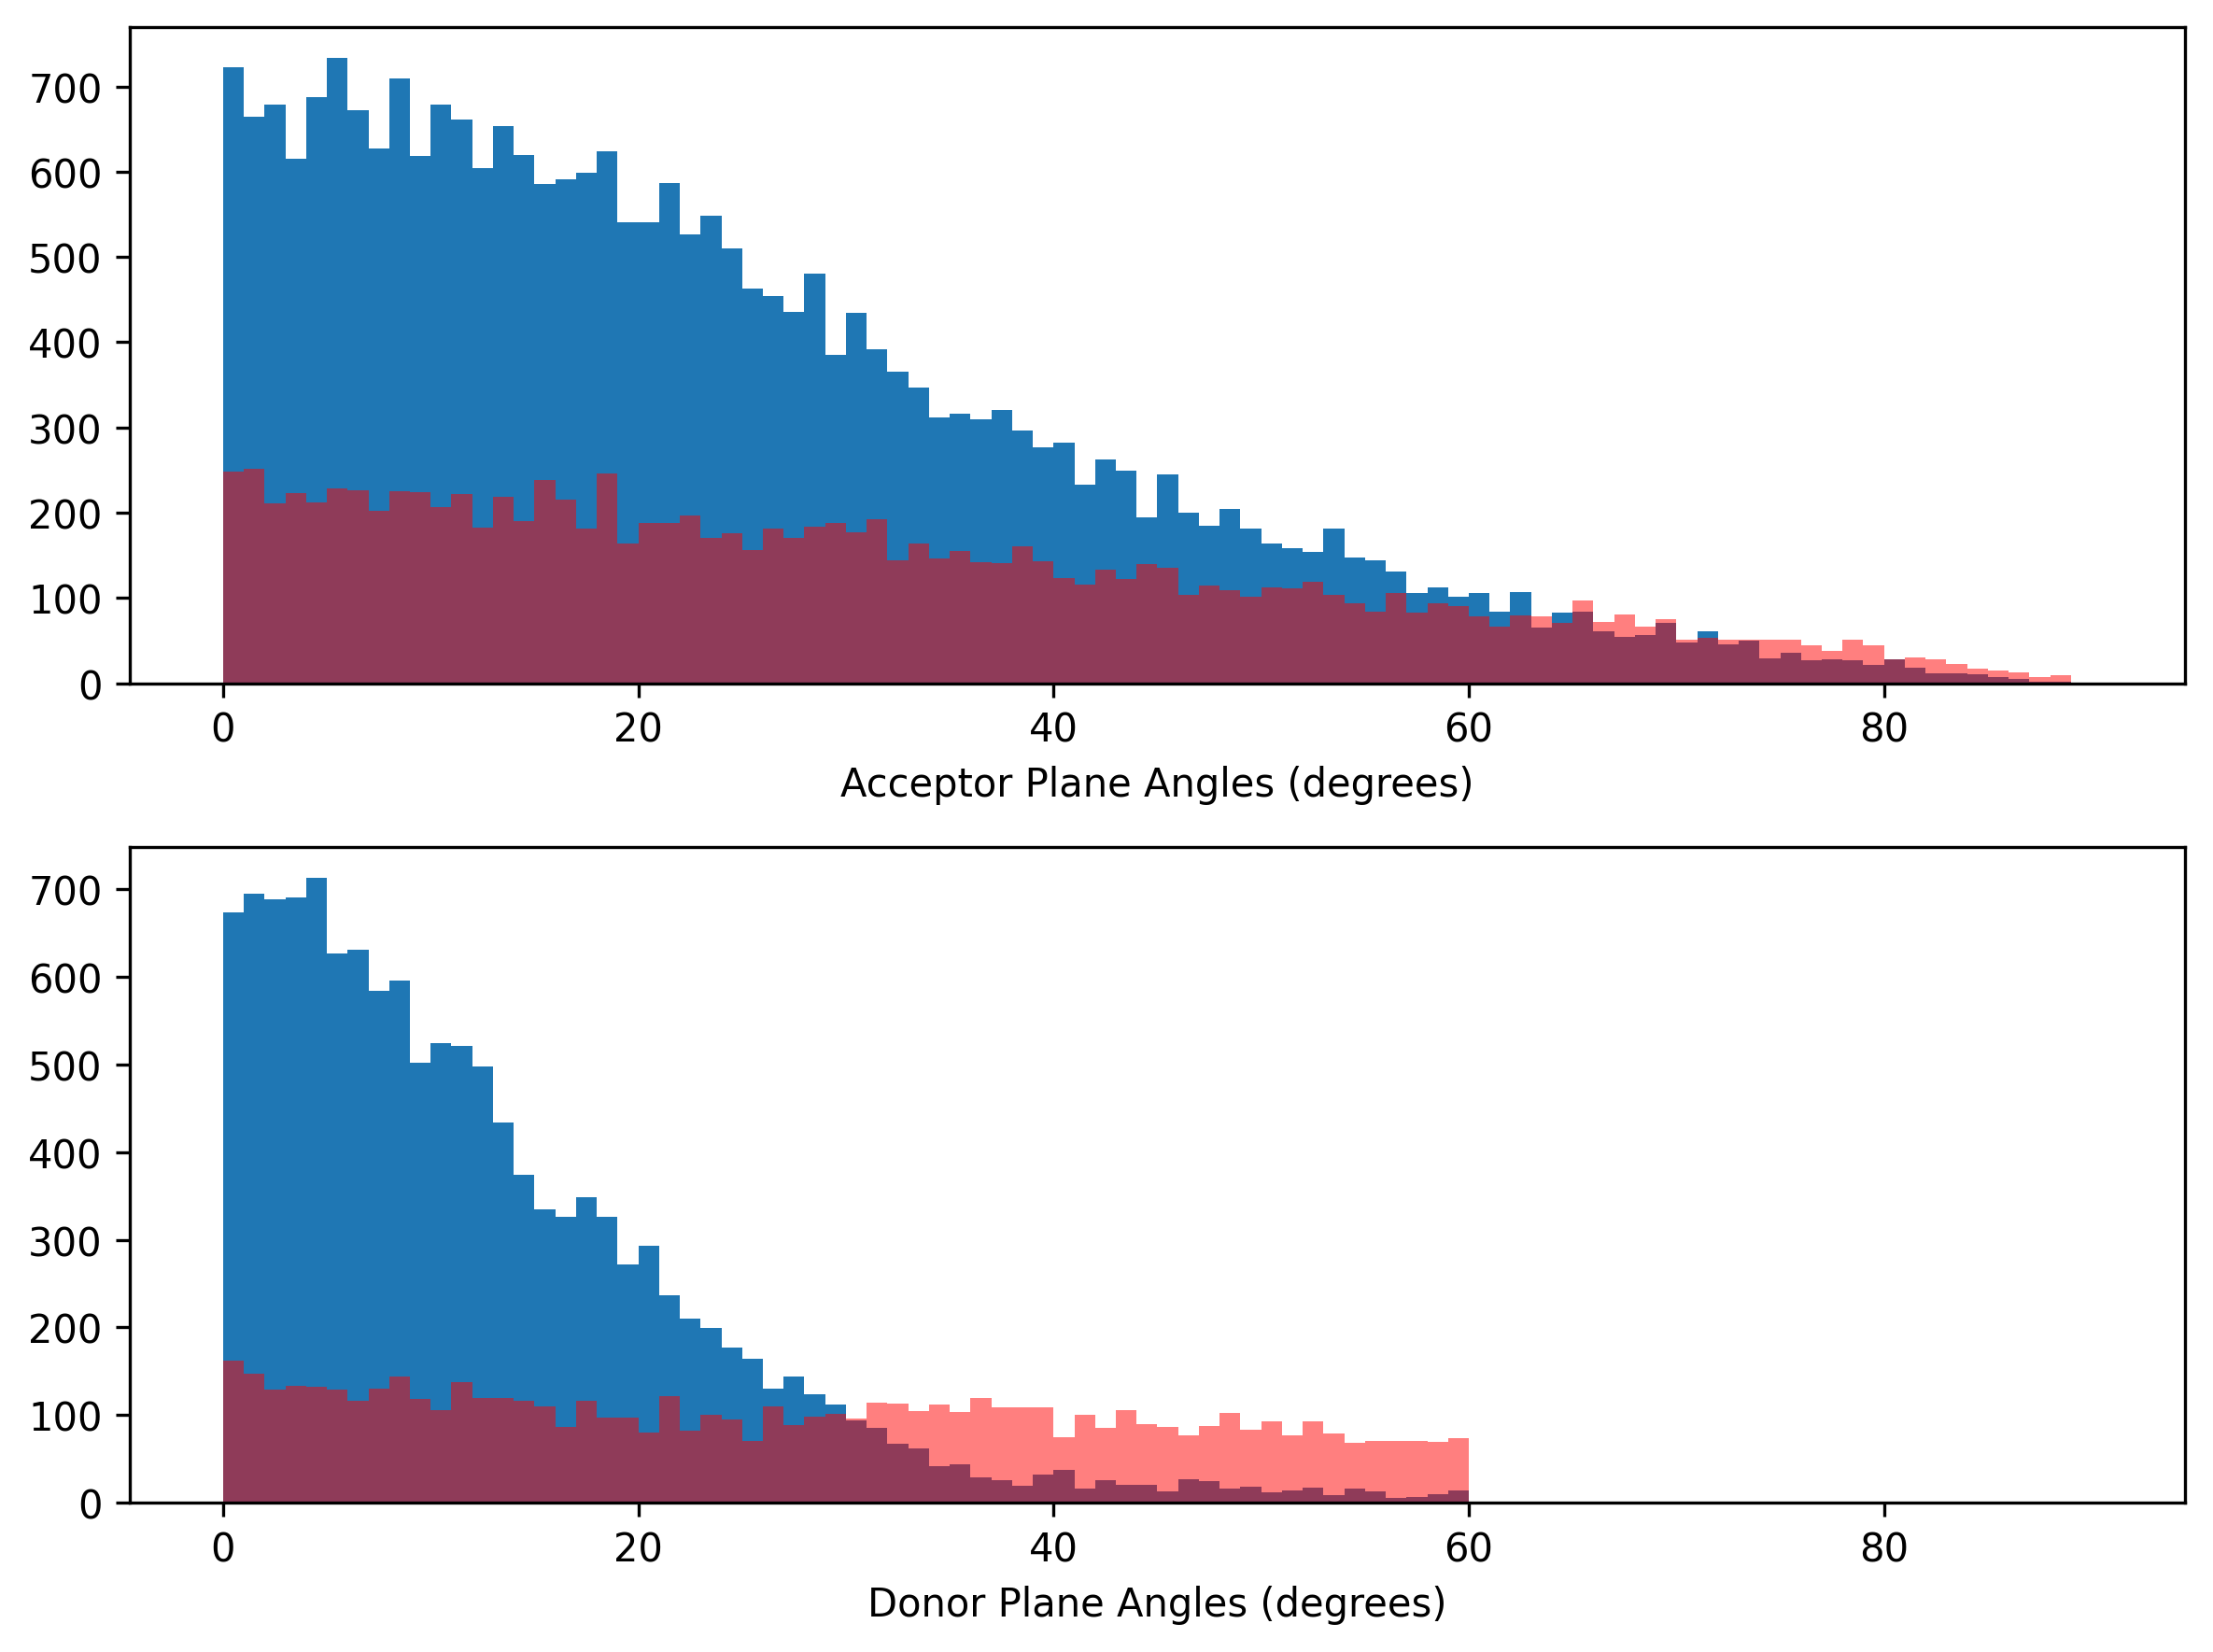
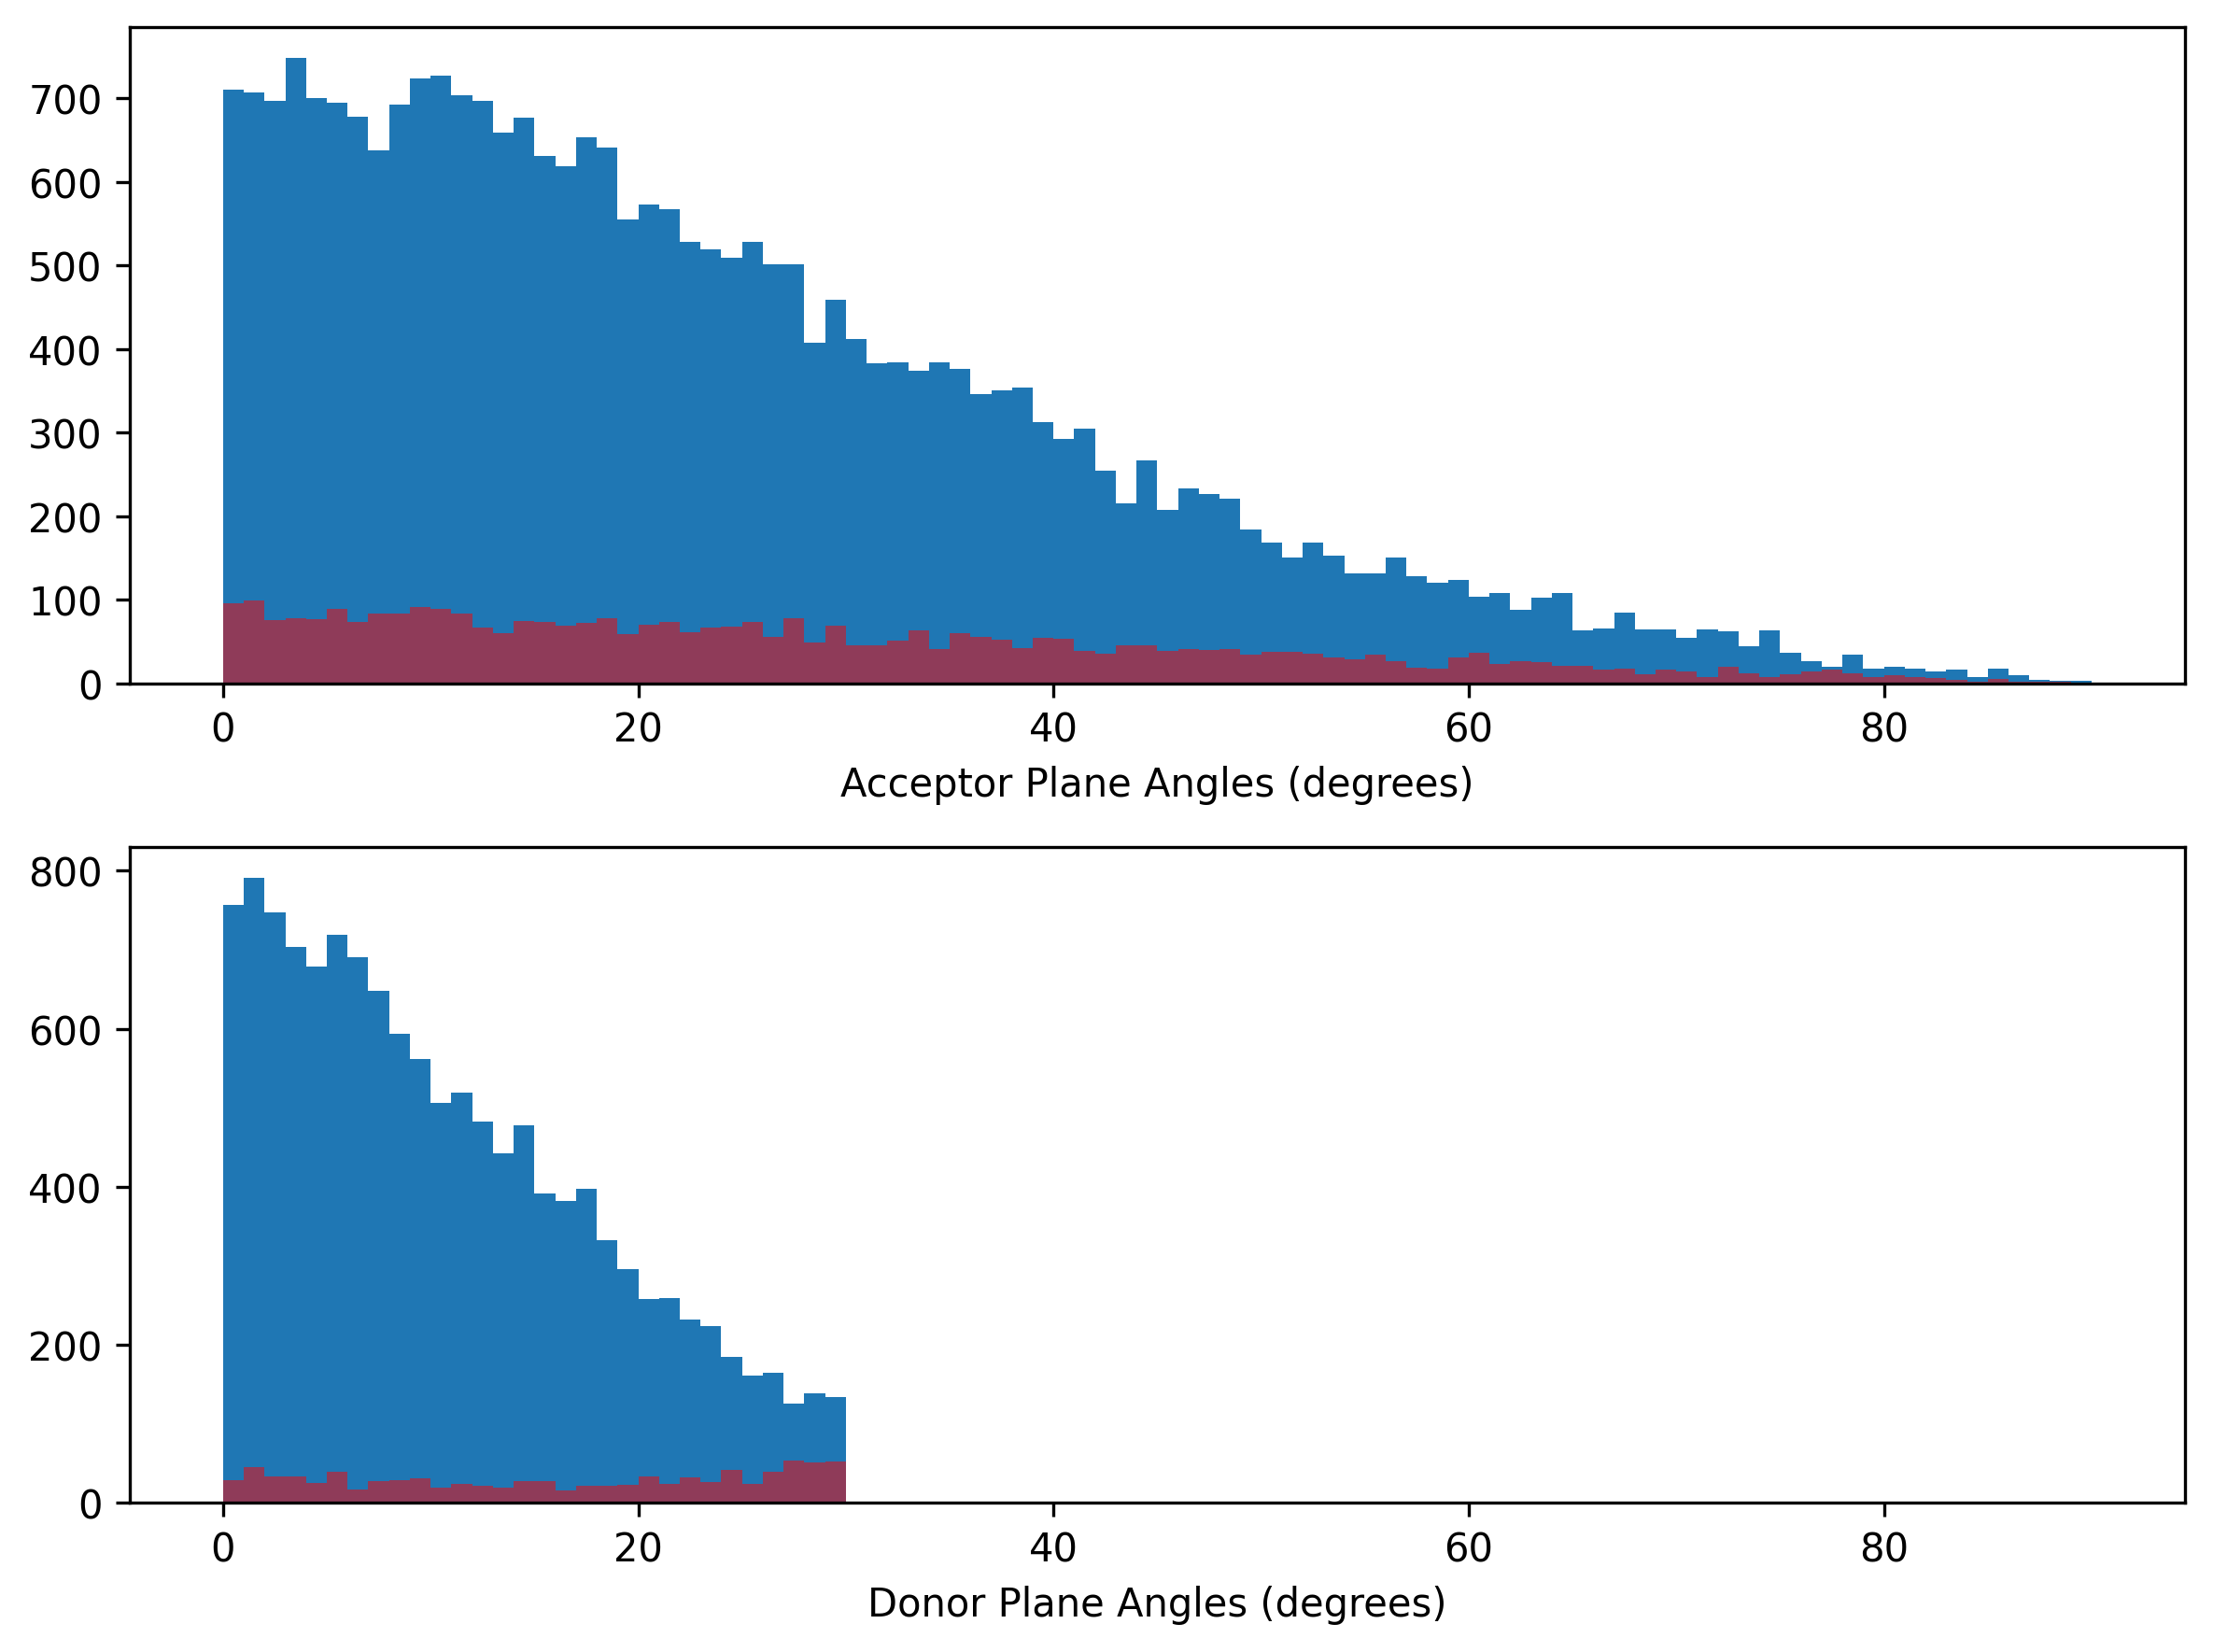
Plane angles’ distribution
Again, there is a clear threshold value (30°) for donor plane angle. There is no specific value for acceptor plane angle to seperate the false positives and ground truths.
Validation set
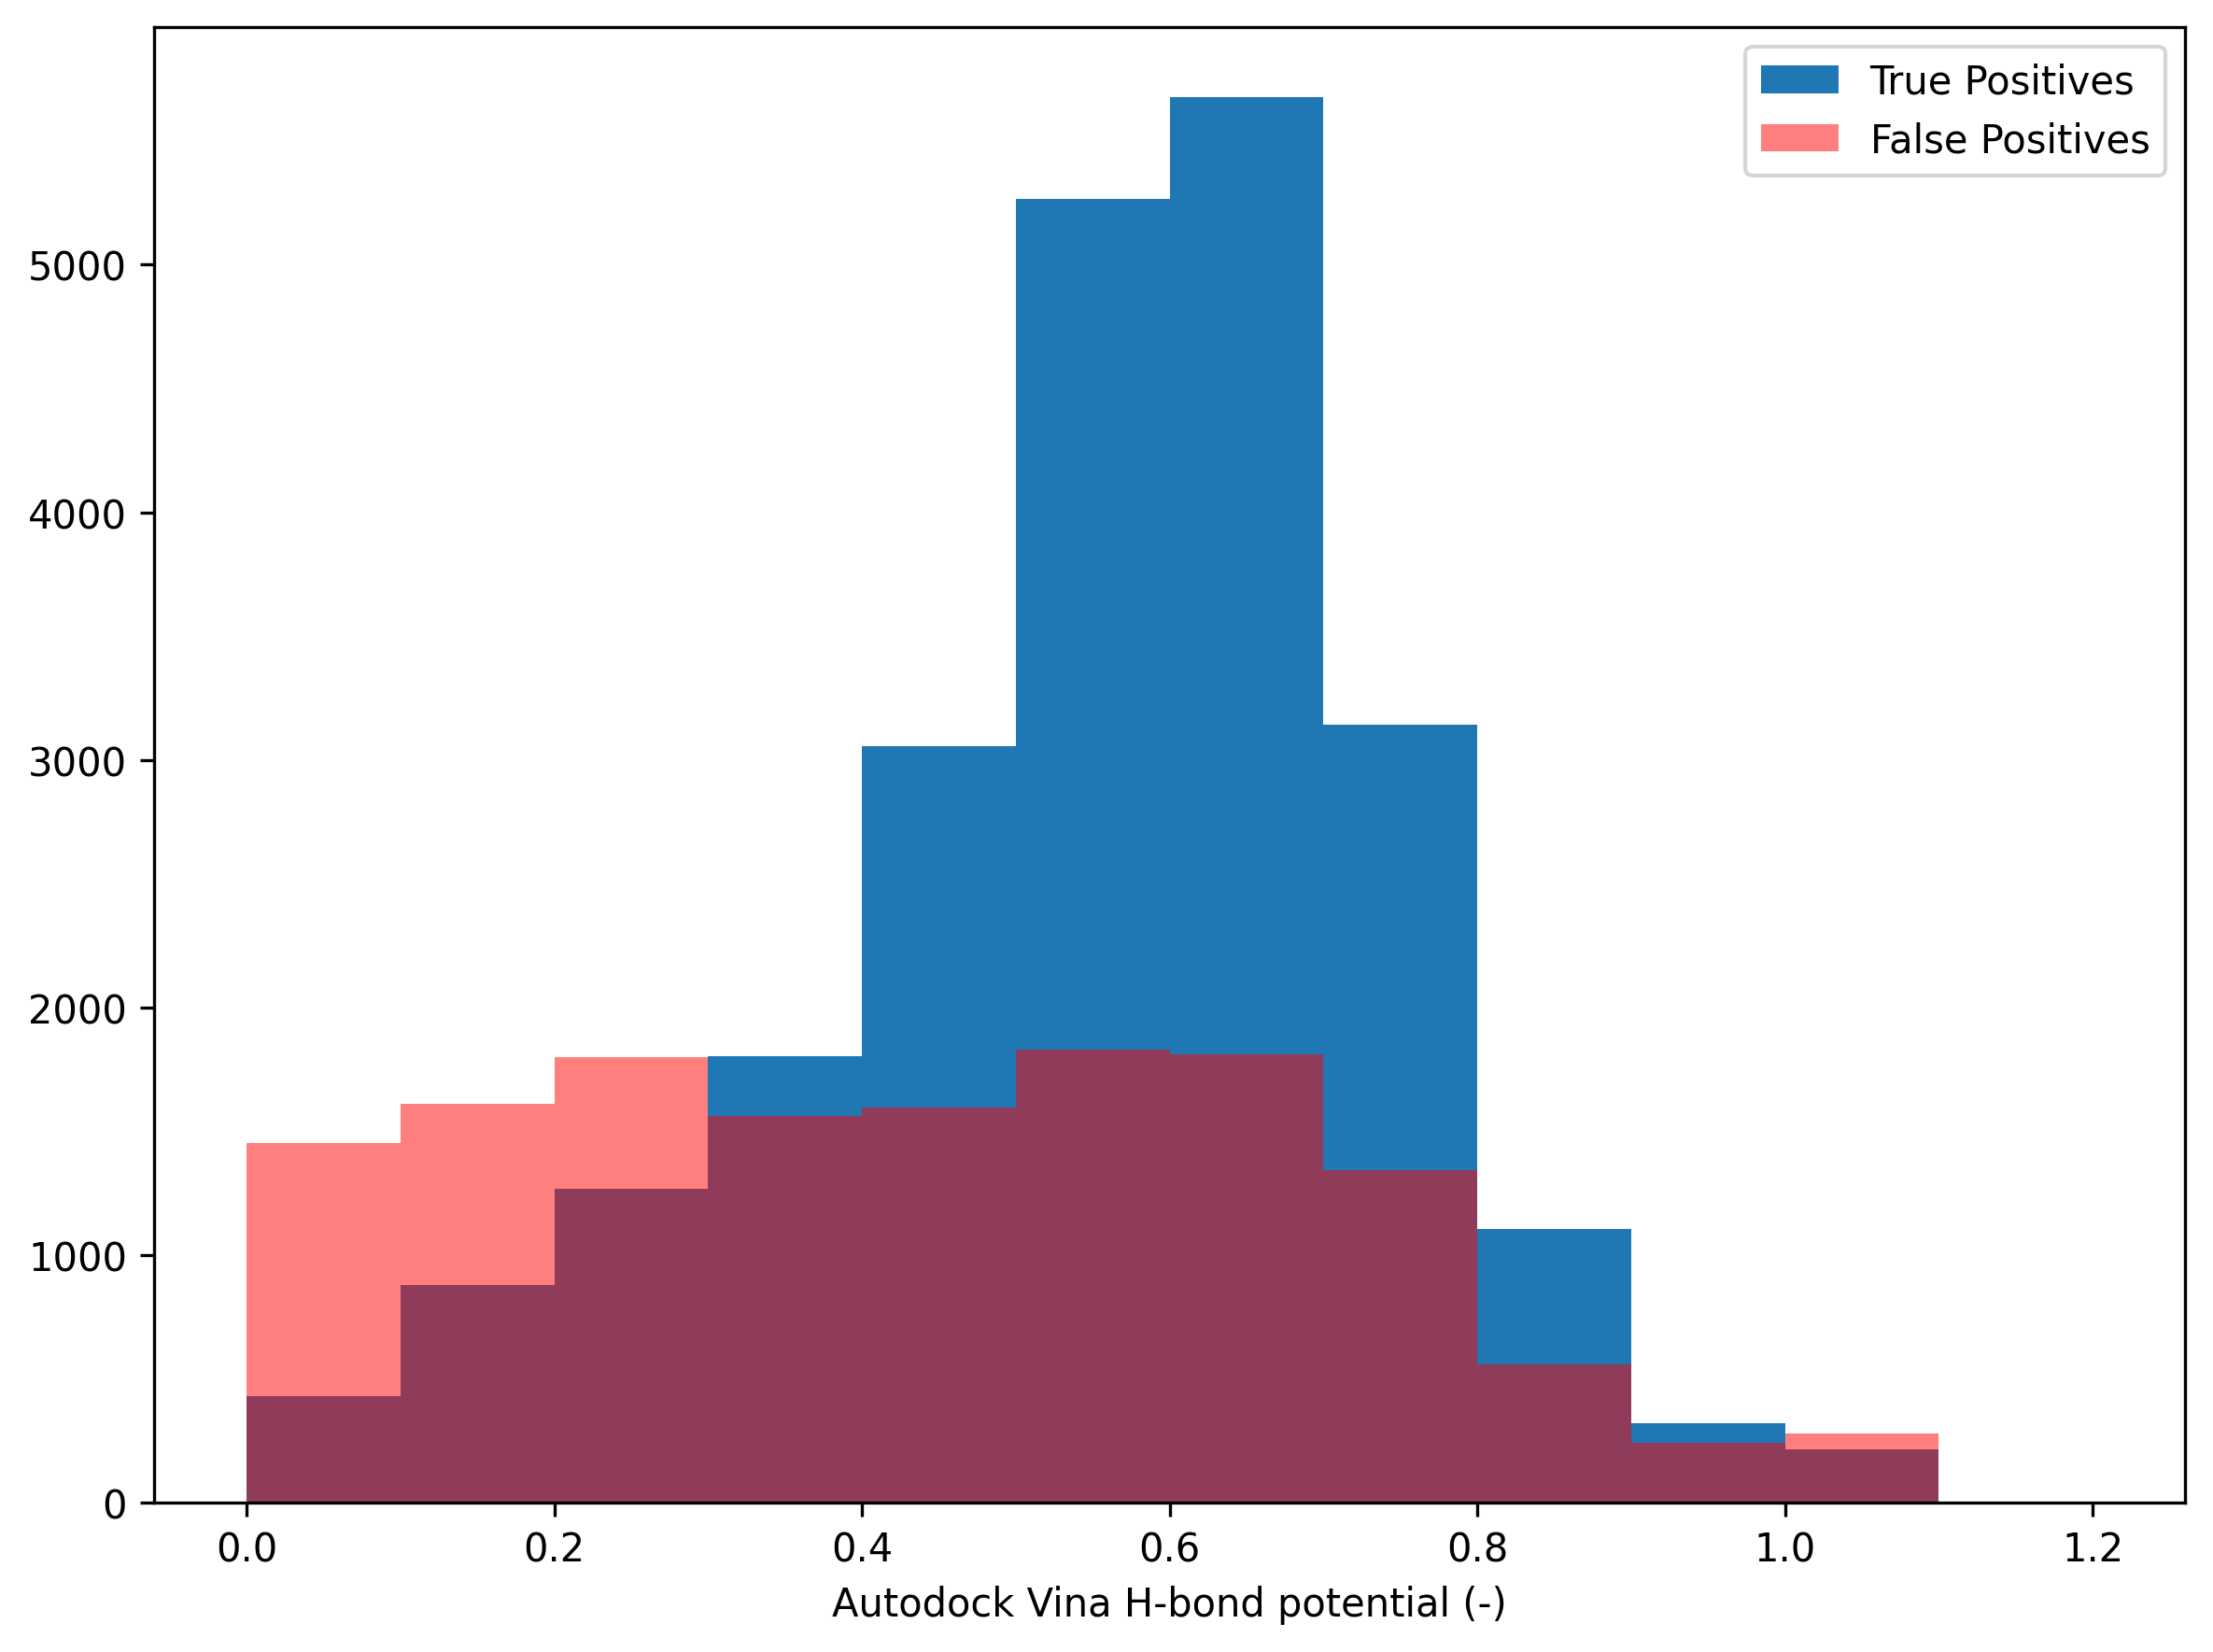
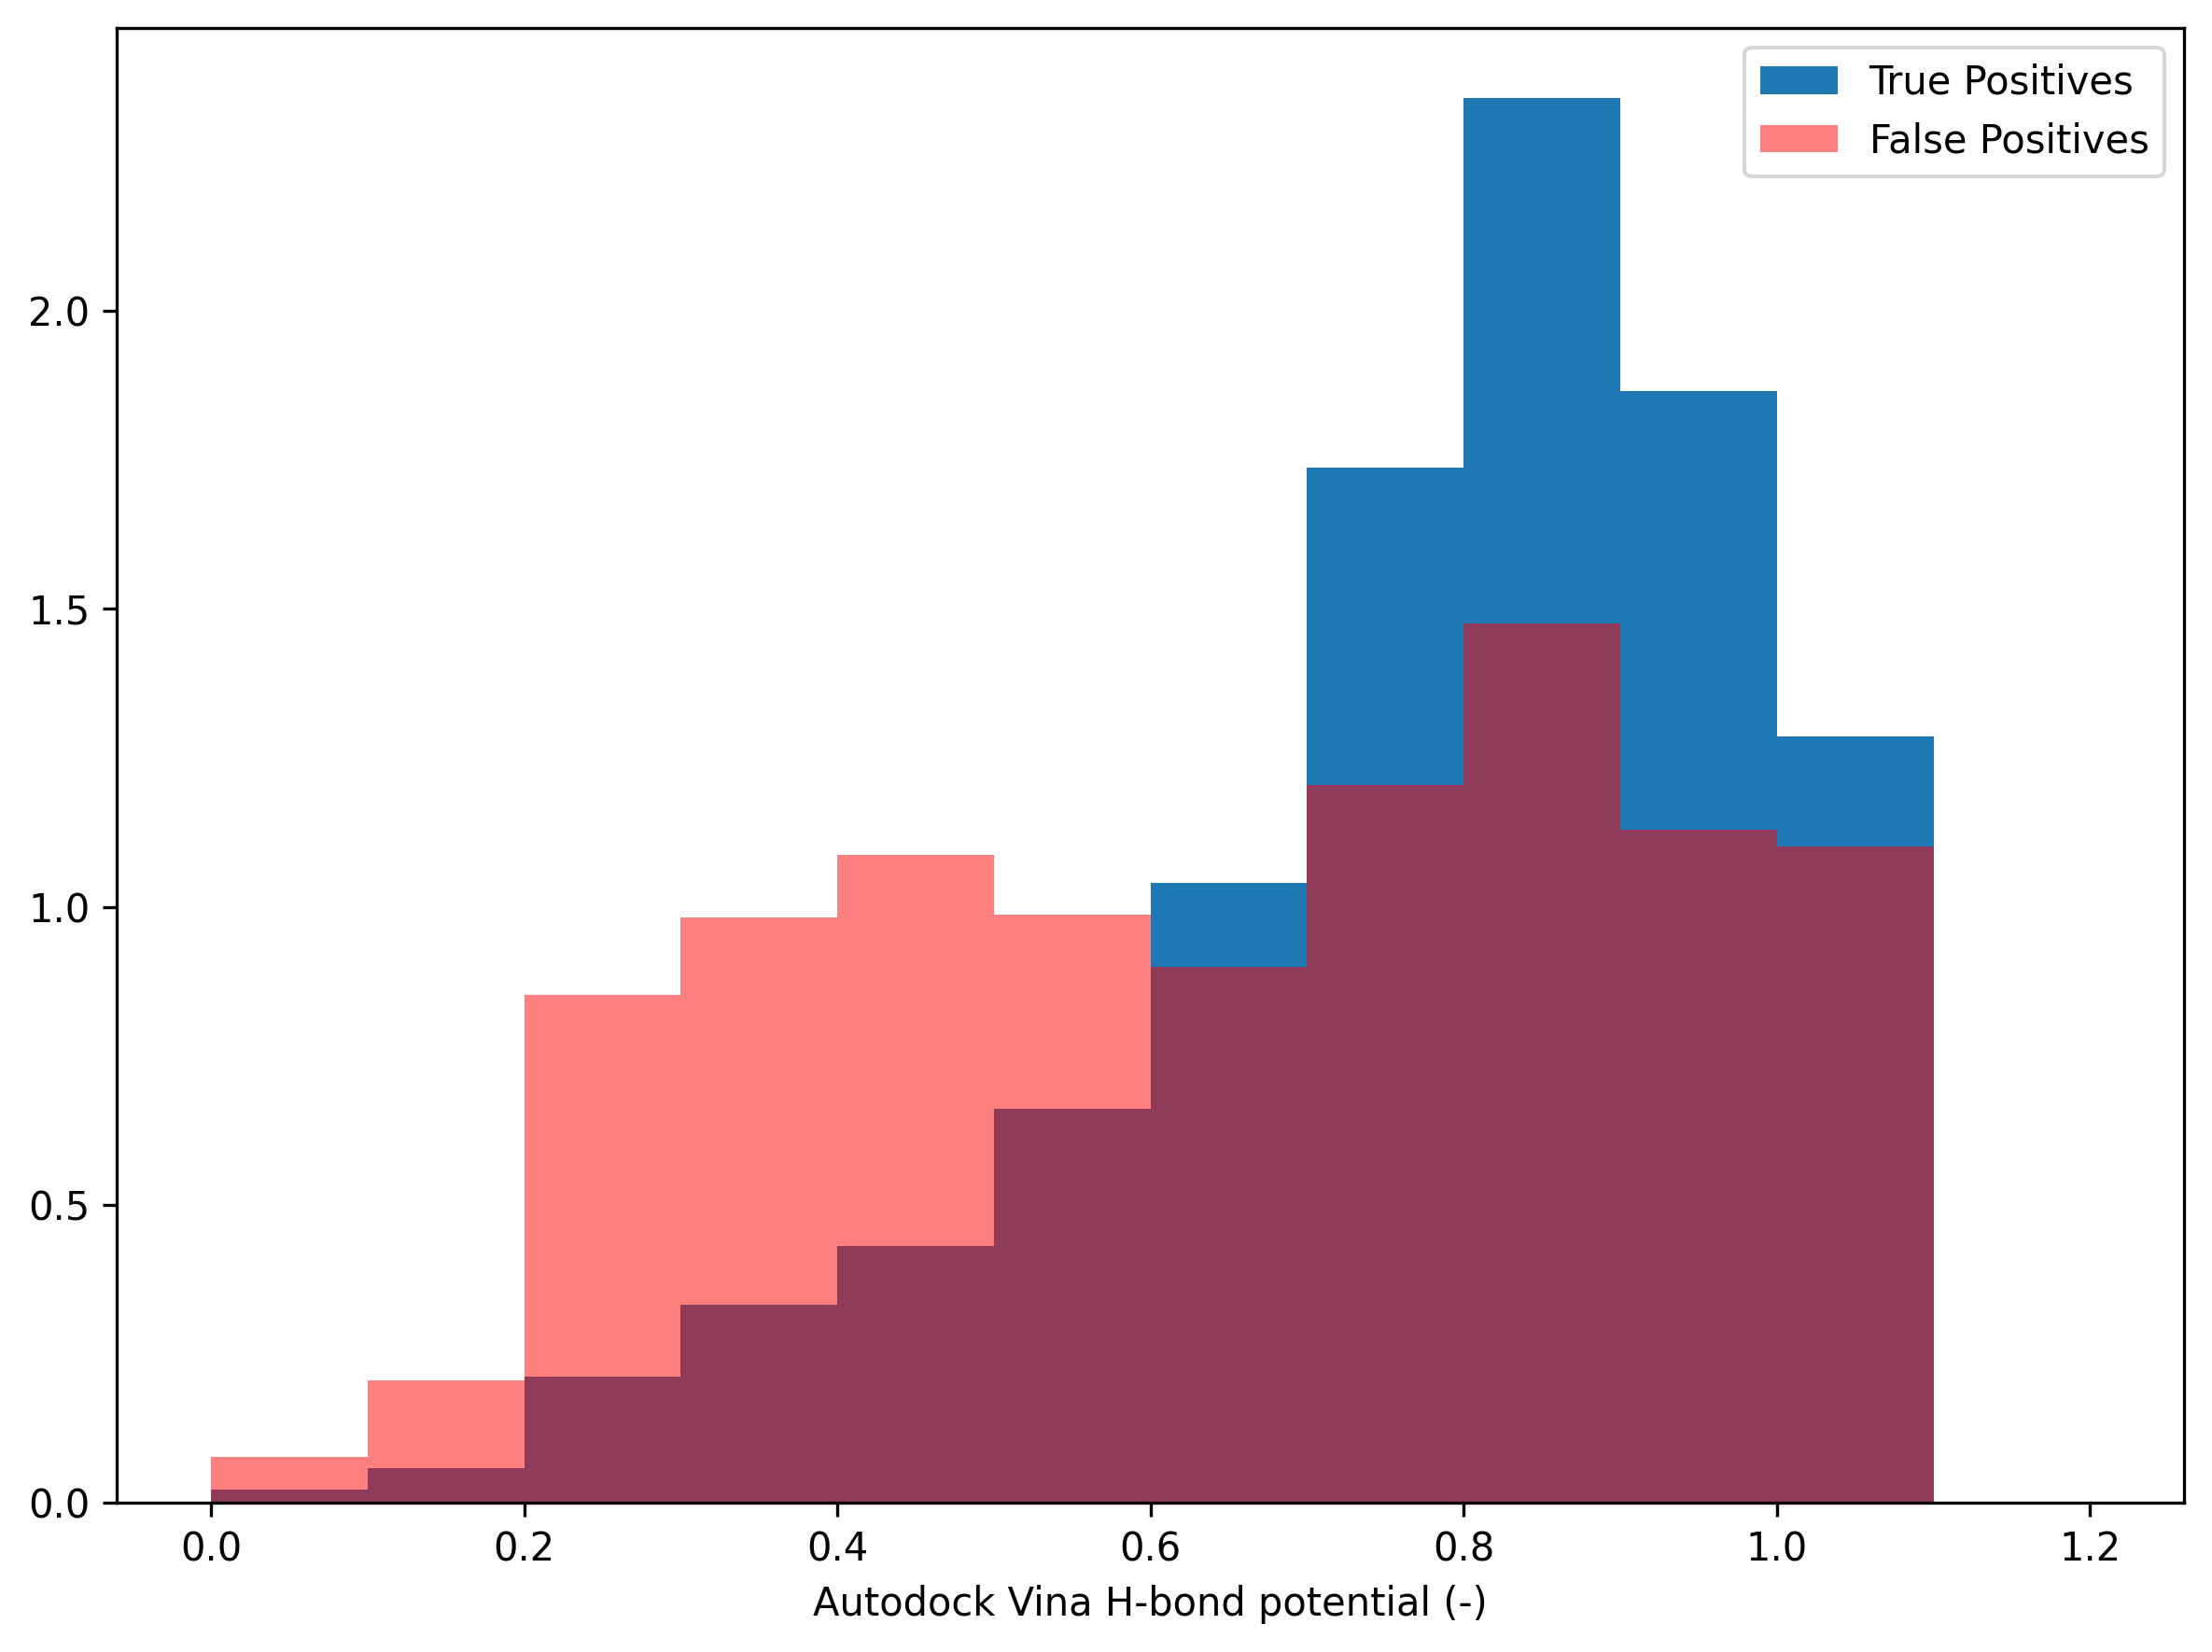
Autodock Vina H-bond potential’s distribution
The AutoDock Vina H-bond potential is an index that highlights the potential for hydrogen bonding by subtracting the sum of the van der Waals radii of the donor and acceptor atoms from the distance between the two atoms and rescaling to the range between 0 (bad interaction) and 1 (good interaction).
Initially, we set the values for good and bad interactions to -0.7 and 0.4, respectively, for the PINDER validation set. Our goal is to adjust the values for good and bad interactions to rescale the distribution so that an AutoDock Vina H-bond potential value of 1 has the highest frequency. Also, if the AutoDock Vina H-bond potential value is less than 0.5, false positives generally outnumber ground truths.
In the below figure, the highest freuqnecy of the ground truth is at AutoDock Vina H-bond potential of 0.7 and the crossing point between ground truth and false positives is around 0.3 (AutoDock Vina H-bond potential). Thus, if we set the values for good and bad interactions to -0.425 and 0.565, respectively, to rescale the AutoDock Vina H-bond potential, we can have the expected distribution of the dataset (also valid for the testing set). A high AutoDock Vina H-bond potential indicates a strong likelihood of forming a hydrogen bond. If the value is less than 0.5, the interaction is likely a false positive.
Validation set
Results on testing set
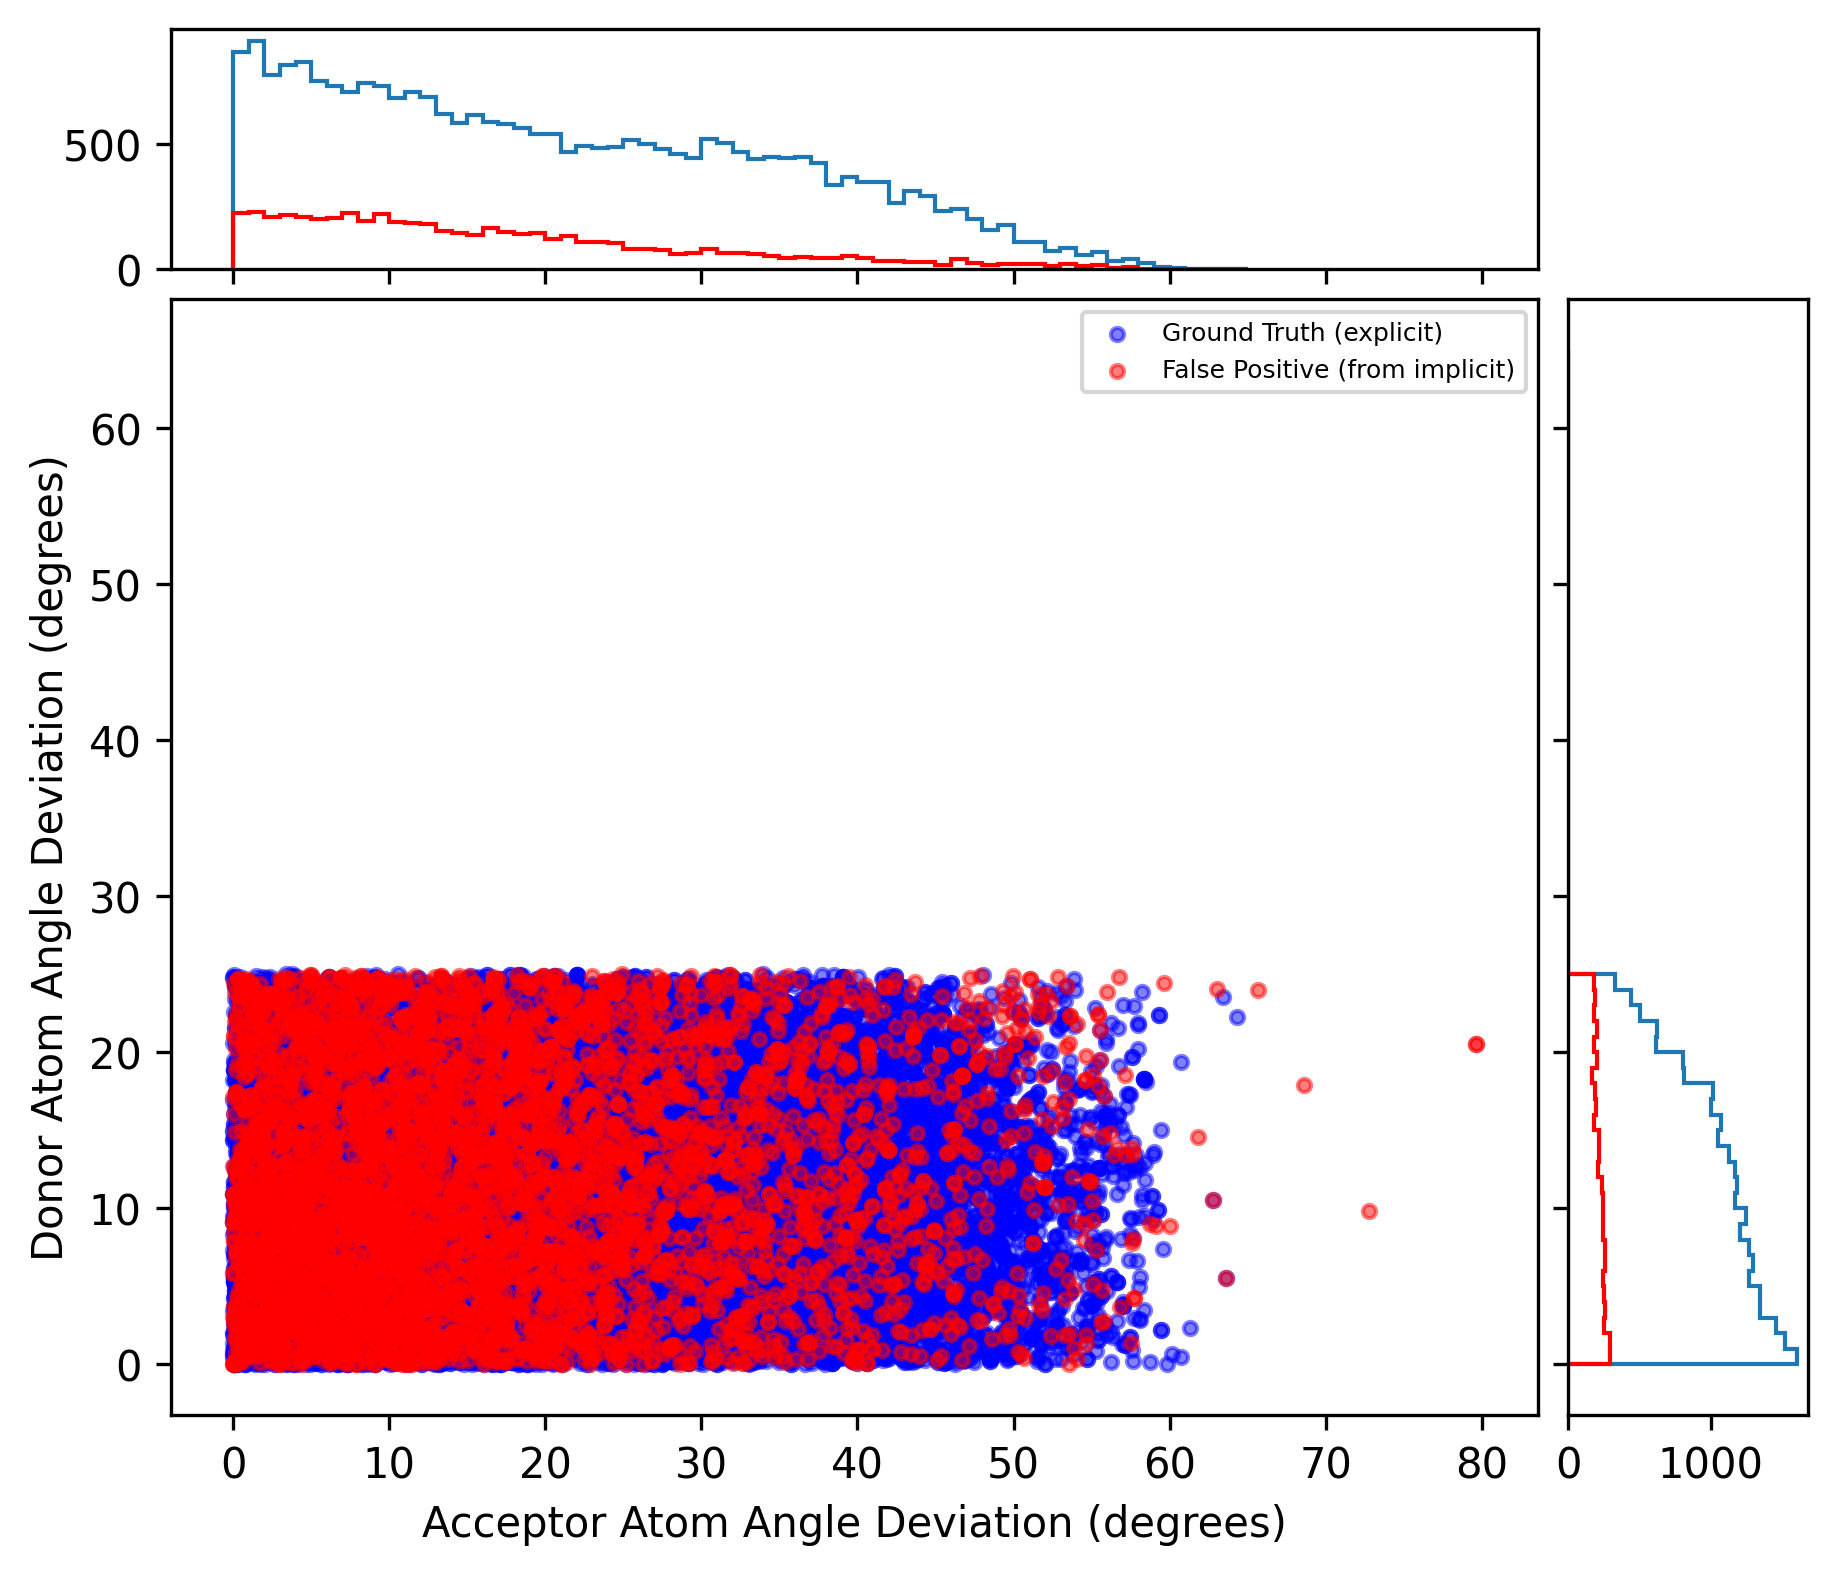
Finally, we present the results on the testing set using the fine-tuned cutoff values. These values were optimized using the PLINDER dataset but exhibited the same trend in the PINDER dataset. On the PINDER testing set, the averaged Tanimoto coefficient is 0.79, the averaged positive predictive values is 0.83, and the averaged sensitivity is 0.94, showing an improvement compared to the results obtained from the validation set without applying specific cutoff values. From the below figures, you can also find the cutoff values we applied on certain parameters. Finally, the distribution of Autodock Vina H-bond potential are roughly shown as we expected.
Distribution of atom angles
Distribution of plane angles
Distribution of Autodock Vina H-bond potential
It is noted that some false positives were excluded based on the cutoff values for the donor atom and plane angle deviation. Instead of “counts,” we used “density” to represent the distribution of AutoDock Vina H-bond potential in the testing set.
Summary
This is the final biweekly progress of my GSoC journey. I hope you enjoyed reading my blog post and gained a comprehensive understanding of our design for the implicit H-bond method. This method will soon be merged into ProLIF main branch. If there is any part unclear for you, please feel free to drop me a message or open an issue on ProLIF to have the discussion.
The next post will be the summary of my Google Summer of Code project.
More about GSoC 2025: MDAnalysis x ProLIF project 5
See how we manage this project: click on this [link]. The code for the validation shown in the blog post is also in the same repo. If you want to know more about the project’s details, you can find it via GSoC Project Page or ProLIF Github.
Note: The top picture was generated by Recraft V3 Raw with Sharp Constrast style, aspect ratio: 16:9, generation count 4 (I picked one picutre out of four.), and prompts: “Create a painting in the strong style of Van Gogh’s post-impressionist approach with lines, blending science, technology, and creativity. Incorporate subtle elements like molecular structures and hydrogen bonds, seamlessly integrated into an abstract, dynamic composition. Use flowing lines and shapes to symbolize progress and innovation, with a harmonious color palette of earthy tones, yellows and whites to evoke a sense of connection between nature and scientific discovery.”.
Last and next posts of GSoC
- Previous: week 10
- Summary of GSoC: GSoC summary 2025